잔글 (→예시) |
잔글 (→예시) |
||
| 9번째 줄: | 9번째 줄: | ||
== 예시 == | == 예시 == | ||
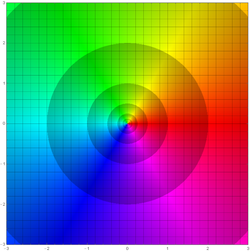
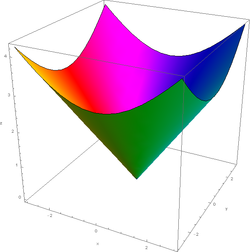
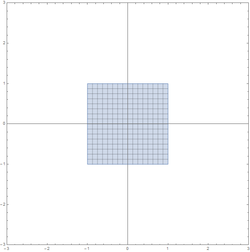
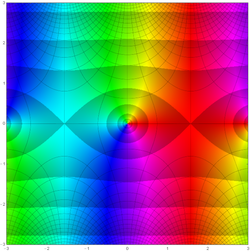
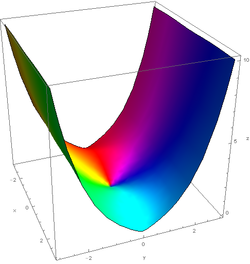
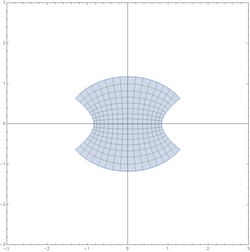
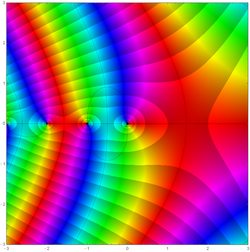
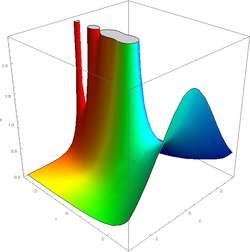
이하 [https://gandhiviswanathan.wordpress.com/2014/10/07/domain-coloring-for-visualizing-complex-functions Gandhi Viswanathan's Blog]의 Mathematica code를 이용하였다. 이는 주기적인 그라데이션으로 함숫값의 절댓값을 표현하며, 그 간격은 <math>2^n</math>이다. 또한 채색된 해석적 랜드스케이프, 한꼴 플로팅과 같이 보여주기로 한다 | 이하 [https://gandhiviswanathan.wordpress.com/2014/10/07/domain-coloring-for-visualizing-complex-functions Gandhi Viswanathan's Blog]의 Mathematica code를 이용하였다. 이는 주기적인 그라데이션으로 함숫값의 절댓값을 표현하며, 그 간격은 <math>2^n</math>이다. 또한 채색된 해석적 랜드스케이프, 한꼴 플로팅과 같이 보여주기로 한다. | ||
{| class="wikitable" | {| class="wikitable" | ||
| 17번째 줄: | 17번째 줄: | ||
! 해석적 랜드스케이프<br/><small>Analytic landscape</small> | ! 해석적 랜드스케이프<br/><small>Analytic landscape</small> | ||
! 한꼴 플로팅<br/><small>Conformal plot</small> | ! 한꼴 플로팅<br/><small>Conformal plot</small> | ||
|- | |||
| 플로팅 영역 | |||
| [-3, 3] × [-3, 3] | |||
| | |||
| [-1, 1] × [-1, 1] → [-3, 3] × [-3, 3] | |||
|- | |- | ||
| <math>f(z) = z</math> | | <math>f(z) = z</math> | ||
| 31번째 줄: | 36번째 줄: | ||
| [[파일:VisualizationOfComplexFunctionByDomainColouring_Gamma.png|250px]] | | [[파일:VisualizationOfComplexFunctionByDomainColouring_Gamma.png|250px]] | ||
| [[파일:VisualizationOfComplexFunctionByAnalyticLandscape_Gamma.png|250px]] | | [[파일:VisualizationOfComplexFunctionByAnalyticLandscape_Gamma.png|250px]] | ||
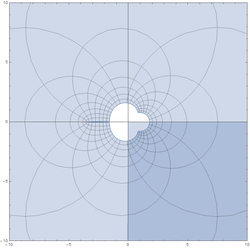
| [[파일:VisualizationOfComplexFunctionByConformalPlot_Gamma.png|250px]] | | [[파일:VisualizationOfComplexFunctionByConformalPlot_Gamma.png|250px]] <br/> 정의역은 [-.5, .5] × [-.5, .5]이며 이미지는 [-10, 10] × [-10, 10]으로 플로팅. | ||
|} | |} | ||
2016년 1월 31일 (일) 20:34 판
정의역 채색(domain colouring)은 복소함수의 시각화를 위한 방법으로, 4 차원의 그래프를 2 차원의 평면에 옮기는 방법이다. 색환 그래프, 채색된 해석적 랜드스케이프(coloured analytic landscape), 등과 함께 가장 많이 쓰이는 방법 중 하나이다.
진술
정의역 채색은 복소함수의 그래프(실수체에서 4 차원)를 정의역, 채도(hue), 명도(lightness)로 나타낸다. 색환 그래프와 다른 점은 명도를 등고선의 용도로 활용한다는 것밖에 없다. (Contour plot)
그리고 명도를 이용하는 방식에 대해서는 딱히 정해진 것이 없다. 양자화의 기준이 되는 함숫값(의 절댓값, 즉 [math]\displaystyle{ |f(z)| }[/math])을 갖는 점을 선으로 이어 놓은 것도 있고, 그 사이의 구간을 그라데이션으로 채워 놓은 것도 있다. 또한 그 양자화의 기준값 역시 정해져 있지 않지만, 대개 [math]\displaystyle{ n }[/math]이나 [math]\displaystyle{ 2^n }[/math]을 기준으로 한다. ([math]\displaystyle{ n\in\mathbb Z }[/math])
채도 역시 정해진 것은 없지만, 대부분 색환의 것을 따른다. 즉, Arg(편각)이 0부터 2π까지 변할 때, 채도는 RGB 순, 더 정확하게는 Red, Yellow, Green, Cyan, Blue, Magenta 순으로 변한다.
예시
이하 Gandhi Viswanathan's Blog의 Mathematica code를 이용하였다. 이는 주기적인 그라데이션으로 함숫값의 절댓값을 표현하며, 그 간격은 [math]\displaystyle{ 2^n }[/math]이다. 또한 채색된 해석적 랜드스케이프, 한꼴 플로팅과 같이 보여주기로 한다.
