Tautochrone_curve.gif (300 × 200 픽셀, 파일 크기: 102 KB, MIME 종류: image/gif, 반복됨, 80 프레임, 3.2 s)
이 파일은 위키미디어 공용에 있으며, 다른 프로젝트에서 사용하고 있을 가능성이 있습니다. 해당 파일에 대한 설명이 아래에 나와 있습니다.
파일 설명
| 설명Tautochrone curve.gif |
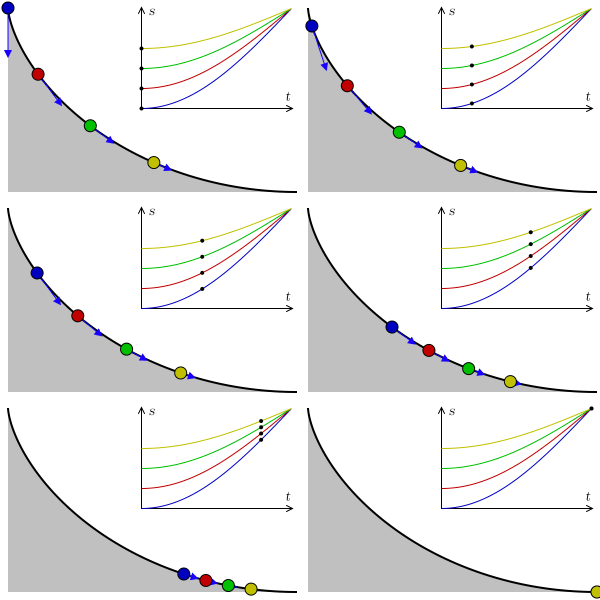
A tautochrone curve is the curve for which the time taken by an object sliding without friction in uniform gravity to its lowest point is independent of its starting point. Here, four points at different positions reach the bottom at the same time. In the graphic, s represents arc length, t represents time, and the blue arrows represent acceleration along the trajectory. As the points reach the horizontal, the velocity becomes constant, the arc length being linear to time. |
| 날짜 | 2007년 5월 9일; new version 2009년 8월 |
| 출처 | 자작 |
| 저자 |
Claudio Rocchini |
| GIF 발전 InfoField | 이 GIF 컴퓨터 그래픽스는 Matplotlib(으)로 제작되었습니다. |
| 소스 코드 InfoField | Python code#!/usr/bin/python
# -*- coding: utf8 -*-
'''
animation of balls on a tautochrone curve
'''
import os
import numpy as np
import matplotlib.pyplot as plt
import matplotlib.patches as patches
from matplotlib import animation
from math import *
# settings
fname = 'Tautochrone curve'
width, height = 300, 200
nframes = 80
fps=25
balls = [
{'a':1.0, 'color':'#0000c0'},
{'a':0.8, 'color':'#c00000'},
{'a':0.6, 'color':'#00c000'},
{'a':0.4, 'color':'#c0c000'}]
def curve(phi):
x = phi + sin(phi)
y = 1.0 - cos(phi)
return np.array([x, y])
def animate(nframe, empty=False):
t = nframe / float(nframes - 1.)
# prepare a clean and image-filling canvas for each frame
fig = plt.gcf()
fig.clf()
ax_canvas = plt.gca()
ax_canvas.set_position((0, 0, 1, 1))
ax_canvas.set_xlim(0, width)
ax_canvas.set_ylim(0, height)
ax_canvas.axis('off')
# draw the ramp
x0, y0 = 293, 8
h = 182
npoints = 200
points = []
for i in range(npoints):
phi = i / (npoints - 1.0) * pi - pi
x, y = h/2. * curve(phi) + np.array([x0, y0])
points.append([x, y])
rampline = patches.Polygon(points, closed=False, facecolor='none',
edgecolor='black', linewidth=1.5, capstyle='butt')
points += [[x0-h*pi/2, y0], [x0-h*pi/2, y0+h]]
ramp = patches.Polygon(points, closed=True, facecolor='#c0c0c0', edgecolor='none')
# plot axes
plotw = 0.5
ax_plot = fig.add_axes((0.47, 0.46, plotw, plotw*2/pi*width/height))
ax_plot.set_xlim(0, 1)
ax_plot.set_ylim(0, 1)
for b in balls:
time_array = np.linspace(0, 1, 201)
phi_pendulum_array = (1 - b['a'] * np.cos(time_array*pi/2))
ax_plot.plot(time_array, phi_pendulum_array, '-', color=b['color'], lw=.8)
ax_plot.set_xticks([])
ax_plot.set_yticks([])
ax_plot.set_xlabel('t')
ax_plot.set_ylabel('s')
ax_canvas.add_patch(ramp)
ax_canvas.add_patch(rampline)
for b in balls:
# draw the balls
phi_pendulum = b['a'] * -cos(t * pi/2)
phi_wheel = 2 * asin(phi_pendulum)
phi_wheel = -abs(phi_wheel)
x, y = h/2. * curve(phi_wheel) + np.array([x0, y0])
ax_canvas.add_patch(patches.Circle((x, y), radius=6., zorder=3,
facecolor=b['color'], edgecolor='black'))
ax_plot.plot([t], [1 + phi_pendulum], '.', ms=6., mec='none', mfc='black')
v = h/2. * np.array([1 + cos(phi_wheel), sin(phi_wheel)])
vnorm = v / hypot(v[0], v[1])
# in the harmonic motion, acceleration is proportional to -position
acc_along_line = 38. * -phi_pendulum * vnorm
ax_canvas.arrow(x, y, acc_along_line[0], acc_along_line[1],
head_width=6, head_length=6, fc='#1b00ff', ec='#1b00ff')
fig = plt.figure(figsize=(width/100., height/100.))
print 'saving', fname + '.gif'
#anim = animation.FuncAnimation(fig, animate, frames=nframes)
#anim.save(fname + '.gif', writer='imagemagick', fps=fps)
frames = []
for nframe in range(nframes):
frame = fname + '_{:02}.png'.format(nframe)
animation.FuncAnimation(fig, lambda n: animate(nframe), frames=1).save(
frame, writer='imagemagick')
frames.append(frame)
# assemble animation using imagemagick, this avoids dithering and huge filesize
os.system('convert -delay {} +dither +remap -layers Optimize {} "{}"'.format(
100//fps, ' '.join(['"' + f + '"' for f in frames]), fname + '.gif'))
for frame in frames:
if os.path.exists(frame):
os.remove(frame)
|
라이선스
나는 아래 작품의 저작권자로서, 이 저작물을 다음과 같은 라이선스로 배포합니다:

|
GNU 자유 문서 사용 허가서 1.2판 또는 자유 소프트웨어 재단에서 발행한 이후 판의 규정에 따라 본 문서를 복제하거나 개작 및 배포할 수 있습니다. 본 문서에는 변경 불가 부분이 없으며, 앞 표지 구절과 뒷 표지 구절도 없습니다. 본 사용 허가서의 전체 내용은 GNU 자유 문서 사용 허가서 부분에 포함되어 있습니다.http://www.gnu.org/copyleft/fdl.htmlGFDLGNU Free Documentation Licensetruetrue |
| 이 파일은 크리에이티브 커먼즈 저작자표시-동일조건변경허락 3.0 Unported 라이선스로 배포됩니다. | ||
| ||
| 이 라이선스 틀은 GFDL 라이선스 변경의 일부로 이 파일에 추가되었습니다.http://creativecommons.org/licenses/by-sa/3.0/CC BY-SA 3.0Creative Commons Attribution-Share Alike 3.0truetrue |
이 파일은 크리에이티브 커먼즈 저작자표시 2.5 일반 라이선스로 배포됩니다.
- 이용자는 다음의 권리를 갖습니다:
- 공유 및 이용 – 저작물의 복제, 배포, 전시, 공연 및 공중송신
- 재창작 – 저작물의 개작, 수정, 2차적저작물 창작
- 다음과 같은 조건을 따라야 합니다:
- 저작자표시 – 적절한 저작자 표시를 제공하고, 라이센스에 대한 링크를 제공하고, 변경사항이 있는지를 표시해야 합니다. 당신은 합리적인 방식으로 표시할 수 있지만, 어떤 방식으로든 사용권 허가자가 당신 또는 당신의 사용을 지지하는 방식으로 표시할 수 없습니다.
이 라이선스 중에서 목적에 맞는 것을 선택하여 사용할 수 있습니다.
설명
이 파일이 나타내는 바에 대한 한 줄 설명을 추가합니다
이 파일에 묘사된 항목
다음을 묘사함
9 5 2007
image/gif
파일 역사
날짜/시간 링크를 클릭하면 해당 시간의 파일을 볼 수 있습니다.
| 날짜/시간 | 섬네일 | 크기 | 사용자 | 설명 | |
|---|---|---|---|---|---|
| 현재 | 2009년 8월 1일 (토) 22:15 |  | 300 × 200 (102 KB) | wikimediacommons>Geek3 | new physically correct version |
