
SVG 파일의 PNG 형식의 미리보기 크기: 600 × 480 픽셀. 다른 해상도: 300 × 240 픽셀 | 960 × 768 픽셀 | 1,280 × 1,024 픽셀 | 2,560 × 2,048 픽셀
원본 파일 (SVG 파일, 실제 크기 600 × 480 픽셀, 파일 크기: 13 KB)
파일 설명
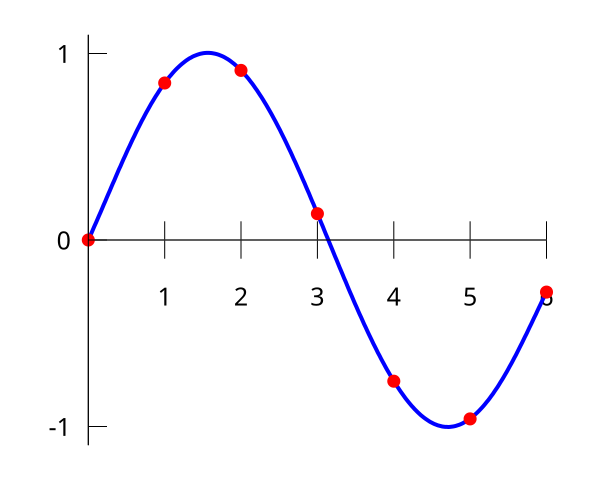
| 설명 | IIllustration of polynomial interpolation of a data set. The same data set is used for other interpolation algorithms in the Interpolation. |
| 날짜 | |
| 출처 | self-made in Gnuplot |
| 저자 | Berland |
Based on png-version by User:Jitse Niesen (with gnuplot source code), and on svg-version by User:Cronholm144.
Gnuplot source code
set terminal svg fname "Vera" fsize 25
set output "Interpolation_example_polynomial.svg"
set key off
set xzeroaxis
set xtics axis 1,1
set ytics nomirror 1
set samples 300
set border 2
f(x) = - 0.0001521*x**6 - 0.003130*x**5 + 0.07321*x**4 - 0.3577*x**3 +  0.2255*x**2 + 0.9038*x
set yrange [-1.1:1.1]
plot f(x) with lines linetype 3 linewidth 4, \
     "-" with points linetype 1 pointtype 7 pointsize 0.7, \
       0 with lines linetype -1 linewidth 1
0 0
1 0.8415
2 0.9093
3 0.1411
4 -0.7568
5 -0.9589
6 -0.2794
e
Please use at least version 4.2 of Gnuplot for smooth lines in SVG.
라이선스
| 이 작품은 저작자인 I, Berland에 의해 퍼블릭 도메인으로 공개된 작품입니다. 이 공개 선언은 전 세계적으로 유효합니다. 만약 저작권의 포기가 법률적으로 가능하지 않은 경우, I, Berland은 이 작품을 법적으로 허용되는 한도 내에서 누구나 자유롭게 어떤 목적으로도 제한 없이 사용할 수 있도록 허용합니다. |
파일 역사
날짜/시간 링크를 클릭하면 해당 시간의 파일을 볼 수 있습니다.
| 날짜/시간 | 섬네일 | 크기 | 사용자 | 설명 | |
|---|---|---|---|---|---|
| 현재 | 2007년 6월 27일 (수) 01:11 | | 600 × 480 (13 KB) | wikimediacommons>Berland | == Summary == {{Information |Description=IIllustration of polynomial interpolation of a data set. The same data set is used for other interpolation algorithms in the Interpolation. |Source=self-made i |
이 파일을 사용하는 문서
다음 문서 1개가 이 파일을 사용하고 있습니다: